


Mike McKenzie
Vice president, Dougherty Mortgage LLC

The relationship among interest rates and cap rates has been studied, explored and analyzed ad infinitum. On a macro level, it’s a relationship worth exploring. On a micro (or individual asset) level, I’m not so sure. What’s important, and remains important, is to get the deal done.
When discussing a recent sale of a large institutional multifamily property, the most honest real estate broker I’ve ever heard speak was asked what the cap rate was. He responded, “It depends on who you ask.” The sellers had no doubt they got 3.75, the buyers thought they stole it at 4.1, the lender underwrote it at 3.94 with great certainty and confidence, and the appraiser signed off at 3.88.
The point is, cap rates can be manipulated – and often are, for a variety of reasons. But this is at the individual asset level. What about at the macro level? Well, at the macro level, generally speaking, things tend to even out and the trends may have meaning. You can start to see some market direction.

That meaning no doubt will vary among different investors. Some may believe that rent increases will rationalize lower cap rates – some in the long run, others in the short run. Some investors, answering to their investor pool or their investor allocation of resources, may have a shorter- or longer-term point of view. All groups likely will be influenced by various economic forecasts of growth, density, wage growth, etc.
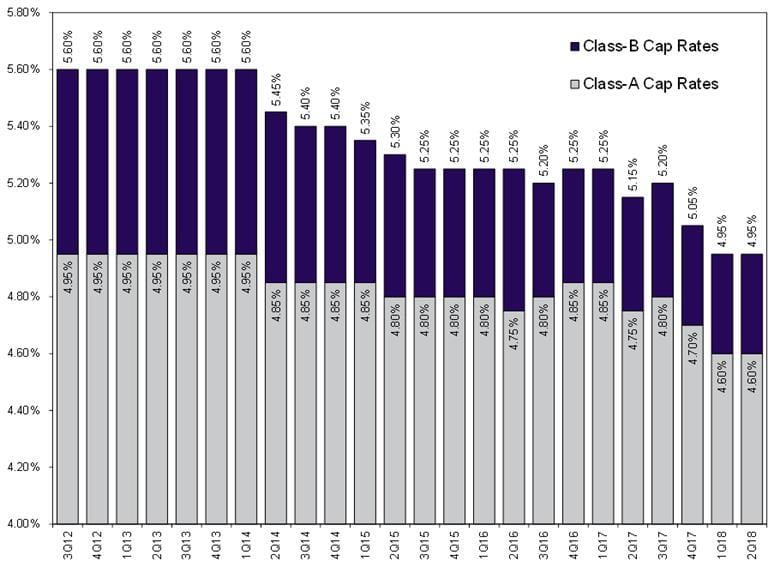
So let’s grab some real data to see if we can identify some trends in order to ask some better questions. My friends at Zelman Associates were kind enough to share some national data on cap rates across Class A and Class B multifamily properties. The data spans from third-quarter 2012 through second-quarter 2018.
No surprise here, cap rates for both Class A and Class B are trending down – very obvious. But which one is moving faster? Class B is trending down faster than Class A. Since third-quarter 2012, Class A has declined from 4.95 to 4.6, a 7 percent decline; Class B has declined from 5.6 to 4.95, a 12 percent decline – somewhat obvious.

Plotting cap rates of Class A and Class B over time, they appear to move in lockstep. Upon closer examination, however, they are declining at different rates. In fact, Class B is declining at three times the rate of the decline in Class A cap rates. This is not quite so obvious.
So what do Class A and Class B cap rates look like plotted against the 10-year U.S. Treasury over time? Doesn’t appear to be much of a relationship – cap rates going down, the 10-year going up. With so much money chasing too few deal opportunities, it’s almost what you’d expect. Although it begs the question, is there a point at which investors will reevaluate and/or reallocate their asset allocation away from multifamily and into more liquid investments.