


David Pierce
Market analyst, CoStar, Washington, D.C.

While outsized rent hikes and affordability concerns have dominated the headlines in Denver’s apartment market in recent years, our robust apartment data set reveals that the environment has become materially more favorable to renters in several respects over the last few years.
Asking rent increases cooled to an average of just over 2 percent annually in 2016 and 2017, following a four-year stretch from 2012-2015 when rents skyrocketed by nearly 6 percent per year.
But that only tells part of the story. Concessions and discounts have become far more prevalent in Denver over the last few years. As expanded upon later, the degree of rent discounting varies significantly across different parts of the metro.

Chart 1, which shows the frequency of concessions by type, represents the aggregation of roughly 150,000 effective rent observations collected since the beginning of 2015. These Denver observations are the product of our company’s 200-strong community caller group, which calls apartments as would-be renters. Among other details, the team inquires about the rents of available apartments, and collects detailed information about concessions or specials being offered. In addition to rent discounts, the “Any Special” category includes other discounts and promotions that don’t directly impact the rent. Most commonly, these are waived or reduced application fees.
The blue arrow indicates that 8 percent of all available apartments were attached to a rent concession in the first quarter of 2015. In fourth-quarter 2017 (indicated by the red arrow), 23 percent of available apartments were attached to some rent concession.
A clear takeaway from this chart is that concessions are highly seasonal. Discounts are far more prevalent during the first and fourth quarters (shaded in orange) than they are in the second and third quarters (shaded in green).

To correct for seasonality and get a clearer picture of concession trends in Denver, we can look at the four-quarter trailing average. Here, we can see that the frequency of rent discounts has essentially doubled – from 9 percent in 2015 to 19 percent in 2017.
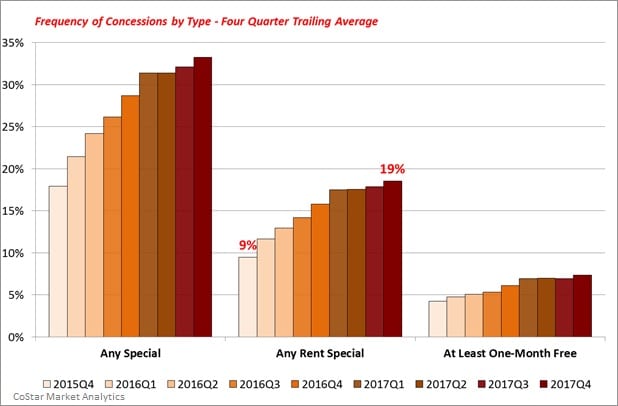
The frequency of rent discounts, corrected for seasonality by looking at the four-quarter trailing average.
Comparing the frequency of more substantial discounts (at least one-month’s free rent) in Denver with the national average shows that while the uptick in Denver has been somewhat more pronounced, the overall frequency of rent concessions remains below the national average. In other words, concessions were almost nonexistent in Denver a few years ago, but have normalized alongside substantial levels of new development.

The overall frequency of rent concessions for Denver, as compared to the nation and Nashville, Tennessee.
Also pictured in the chart is Nashville, Tennessee, which saw concessions rise from almost nonexistent levels a few years ago to one of the higher rates in the country today. Whereas the uptick in concessions in Nashville promotes the case that the metro may have been overbuilt, Denver appears to have better handled outsized levels of new supply.
So where in Denver can renters find the best deals? The map shows the frequency of discounts of at least one-month’s rent by ZIP code over the last six months. Renters can find the best deals in the greater downtown area. In the ZIP codes that incorporate the River North, Lower Highland and Jefferson Park neighborhoods, discounts of at least one month’s rent were tied to more than 25 percent of all available apartments. Notably, one-month discounts are few and far between in Denver’s red hot Lower Downtown neighborhood, despite massive levels of development over the last few years. Already Denver’s premier destination, the recent opening of a Whole Foods in the heart of LoDo may have further improved the bargaining power of property managers in the area.

The frequency of discounts of at least one-month’s rent by ZIP code over the last six months across the metro area.
Lofty discounts also are common in Cherry Creek, Glendale and Denver’s pricy southeast suburbs (such as Lone Tree), all of which have experienced substantial levels of development in recent years. Outside of these areas, one-month discounts are rare, and limited to a handful of neighborhoods that have seen significant development (such as Olde Town Arvada).
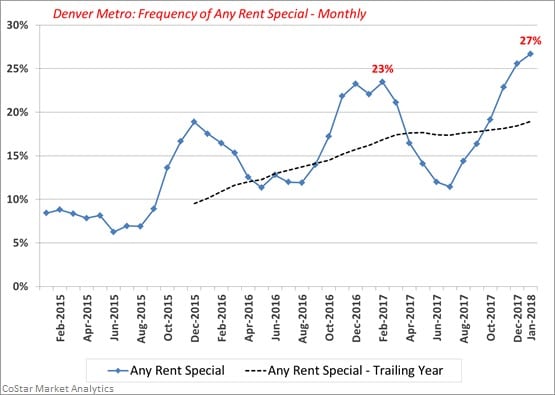
Frequency of any rent special in metro Denver
Concessions are likely to further escalate in 2018. In January, 27 percent of all rents were tied to a rent concession, up from a peak of 23 percent during the prior winter leasing season. That uptick coincides with Denver’s next supply wave, which kicked off in earnest during the second half of 2017. This supply wave will continue for another two years, as nearly 10,000 new apartments are expected to deliver in each 2018 and 2019.
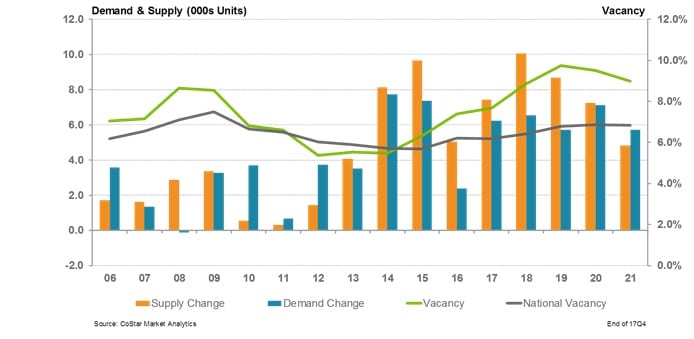
Denver’s multifamily supply and demand
Almost half of the apartment pipeline is concentrated in the greater downtown area. Downtown Denver, which already has the highest frequency of concessions in the metro, will likely retain a highly competitive leasing environment for at least another few years.